APPLE
"MANAGEMENT INSIGHTS DASHBOARDS" PROJECT
UI Designer
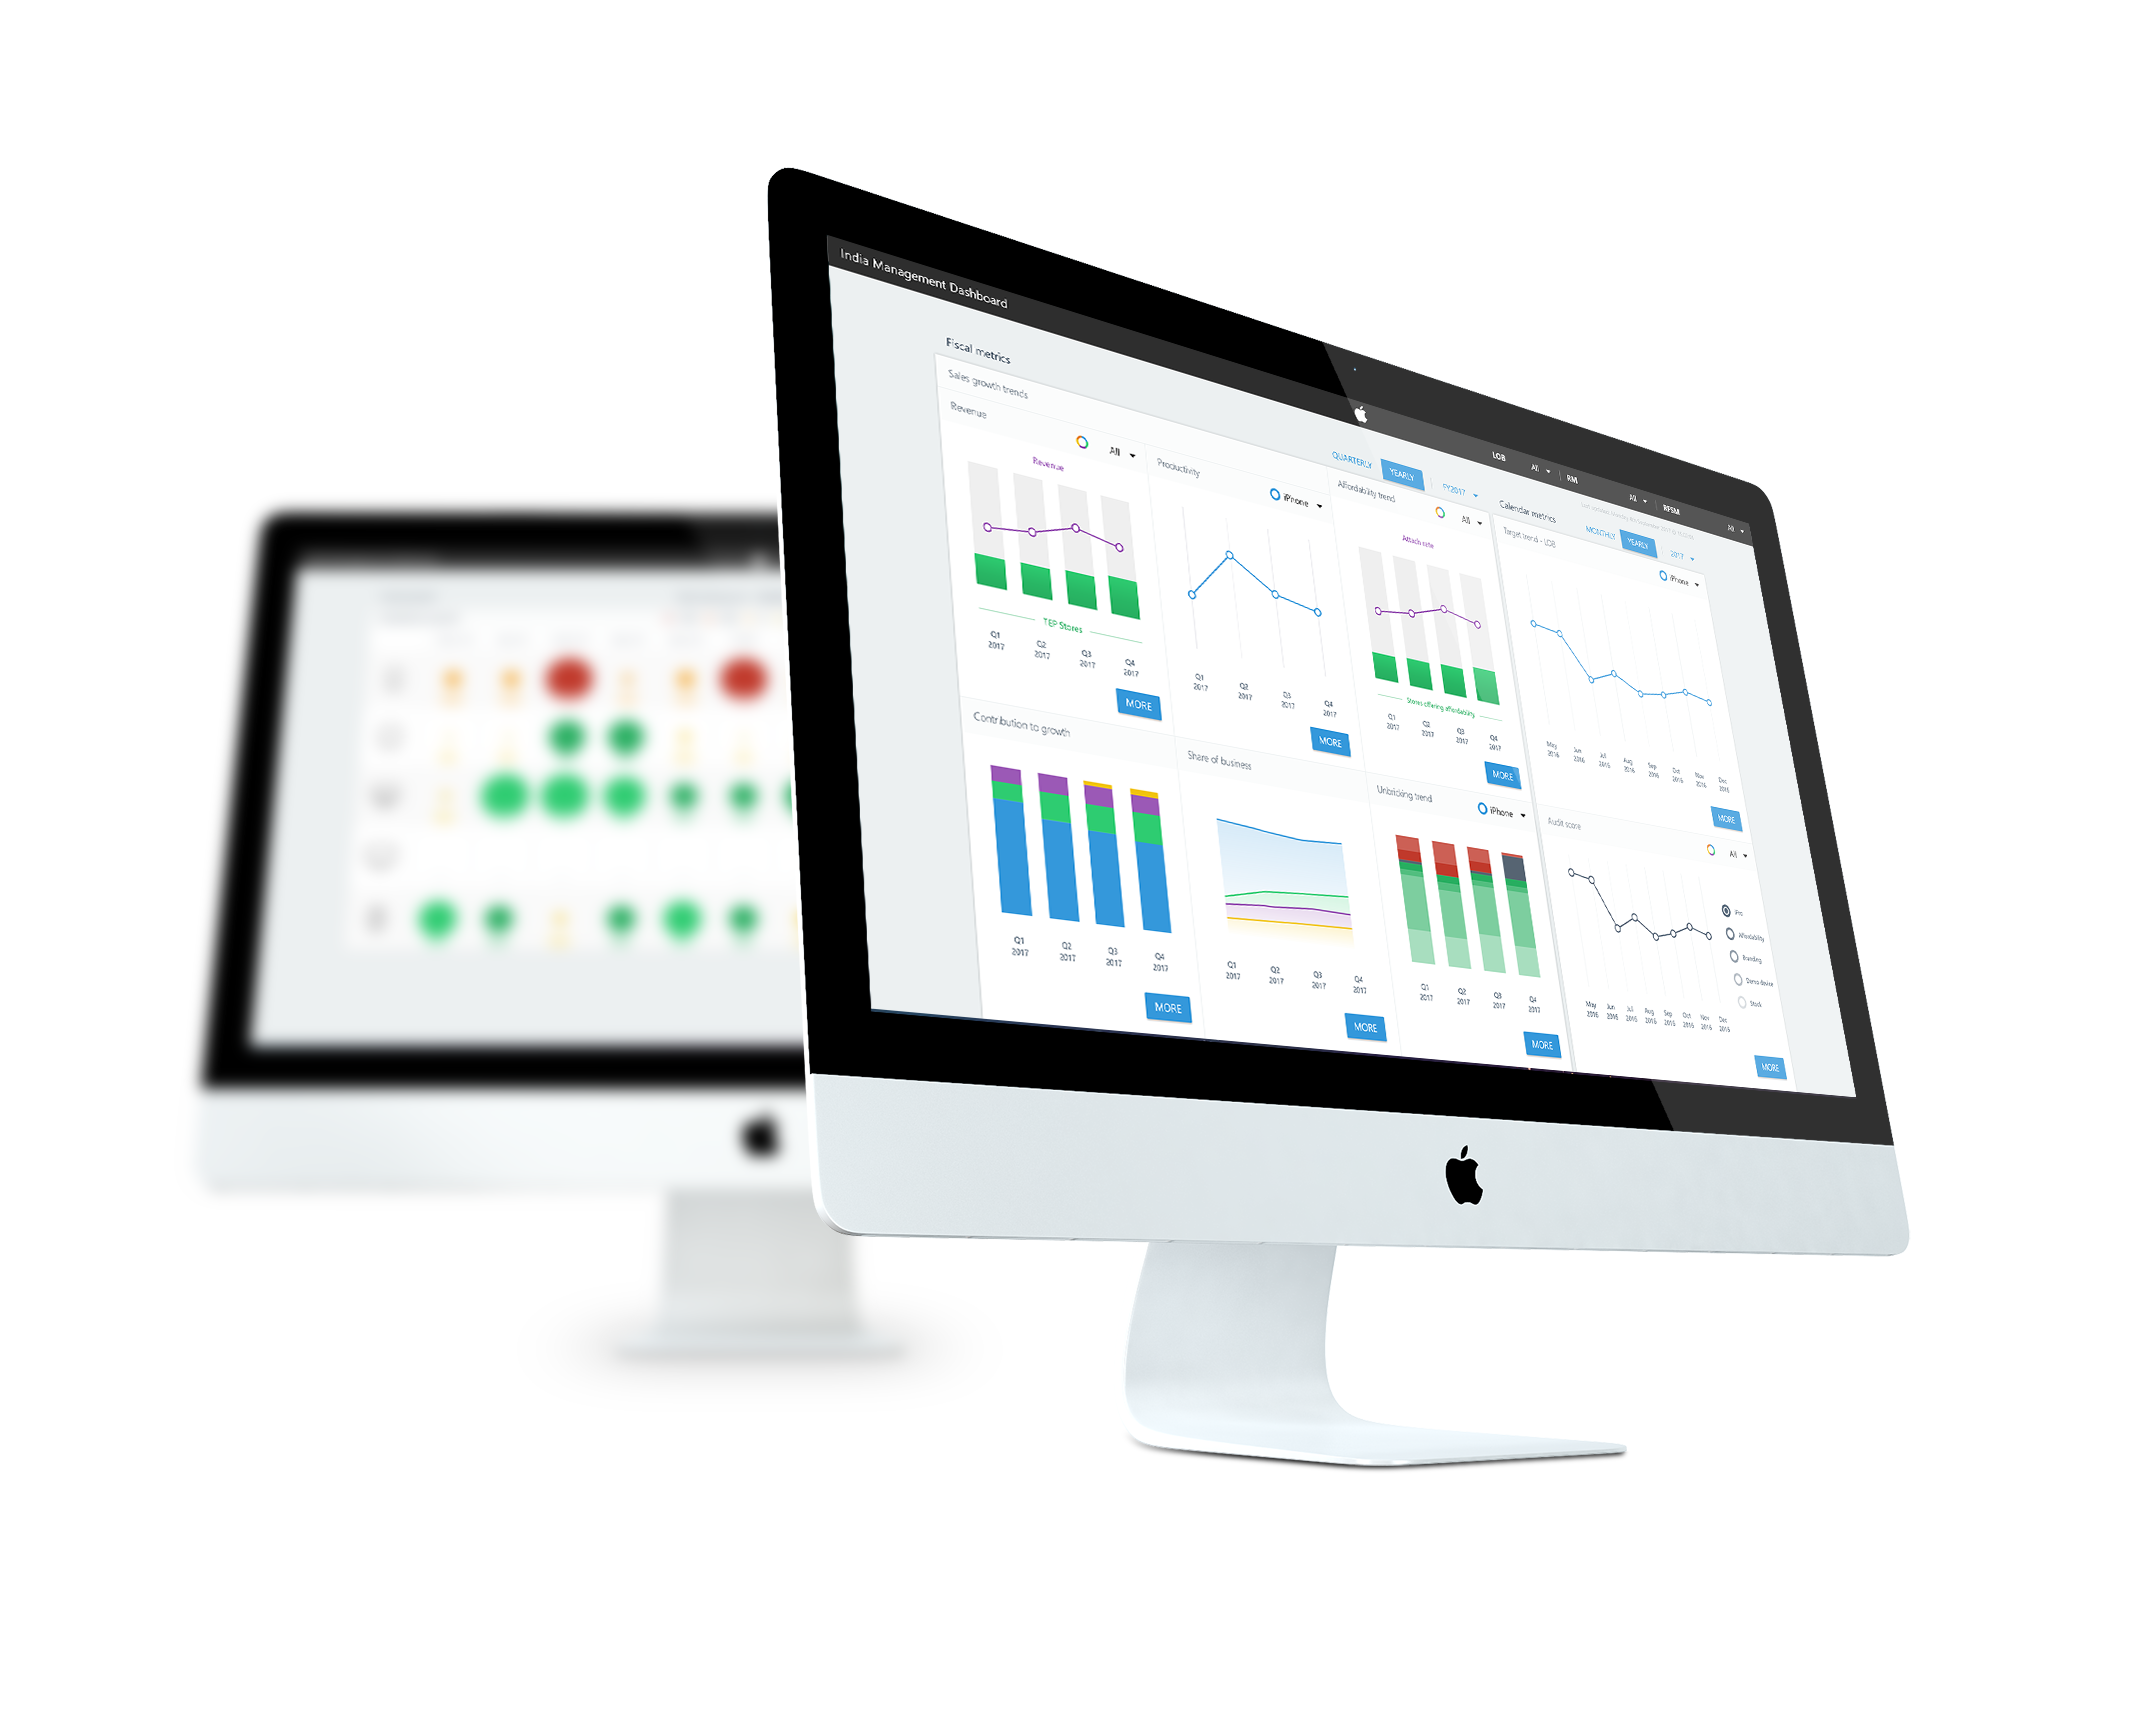
Within the Global Business Intelligence function at Apple, I was engaged to redesign and support the development of UI across a suite of executive dashboards used to track revenue streams and product movement from warehouse to point of sale across global markets.
The work centred on big-data visualisation, translating complex datasets into clear, interpretable views that enable rapid insight. A key requirement was to ensure outputs were presentation-ready, allowing leadership to capture high-quality visuals directly from the dashboards for use across the business.
For this project I used:
Adobe XD
Adobe Illustrator
Adobe Photoshop
Tableau
CHALLENGE
Raw data at scale is inherently difficult to interpret without structure. Effective visualisation is critical to transform complex datasets into clear, actionable insight.
Within the Global Business Intelligence function at Apple, a key focus was tracking devices from factory through to point of sale. While the underlying data highlighted trends, it did not fully communicate operational gaps or inefficiencies to stakeholders.
The solution centred on designing data visualisations that exposed these gaps clearly, enabling C-level and regional leadership to understand performance issues at a glance.
SOLUTION
At Apple, the requirement was to leverage existing tooling rather than introduce new platforms. Using Tableau as the foundation, the focus was on designing dashboards that effectively visualised complex operational data.
Despite no prior experience with Tableau, I rapidly adapted, applying a strong technical foundation to produce initial visualisations within days and fully realised dashboard views within weeks.
The outcome enabled faster, more informed decision-making, improved operational efficiency, and contributed to reducing revenue leakage at scale.
UI DESIGNER
Using colour, typography and big data analysis, I was tasked to design Tableau dashboards to visualise data from different geogrphical areas through the sales pipeline, from warehouse to POS.
Together with the team, we identified key metrics and data points that would be of interest to the users of these dashboards to tailor the design for the best experience.