BP
"SYNAPSE" PROJECT
UX Designer - UI Designer - Logo Designer - Front End Developer
Operating within a high-performing agile team of six, I led delivery across UX, UI, and front-end development, taking full ownership of the end-to-end experience from concept through to implementation.
Working in close partnership with users and senior stakeholders, we delivered a community-driven, visually rich platform that enabled the business to map and understand its application ecosystem at scale. By visualising how individuals interact with and move between systems on a daily basis, the solution exposed inefficiencies, surfaced best practices, and created a shared understanding across global regions.
The outcome was a powerful operational tool that not only improved process visibility but also drove alignment, standardisation, and more informed decision-making across the organisation.
For this project I used:
Adobe XD
Adobe Illustrator
Adobe Photoshop
Atom
HTML
CSS
Javascript
jQuery
NodeJS
Microsoft Azure
Microsoft Active Directory
CHALLENGE
Teams across geological and scientific functions relied on a fragmented set of tools to process complex data matrices - extracting specific variables, transforming formats, and restructuring datasets for use across multiple applications. These ranged from off-the-shelf solutions to bespoke tools developed internally by the users themselves.
The initial challenge was to map this ecosystem in full: identifying all applications in use, understanding how and why they were used, and uncovering the dependencies and connections between them.
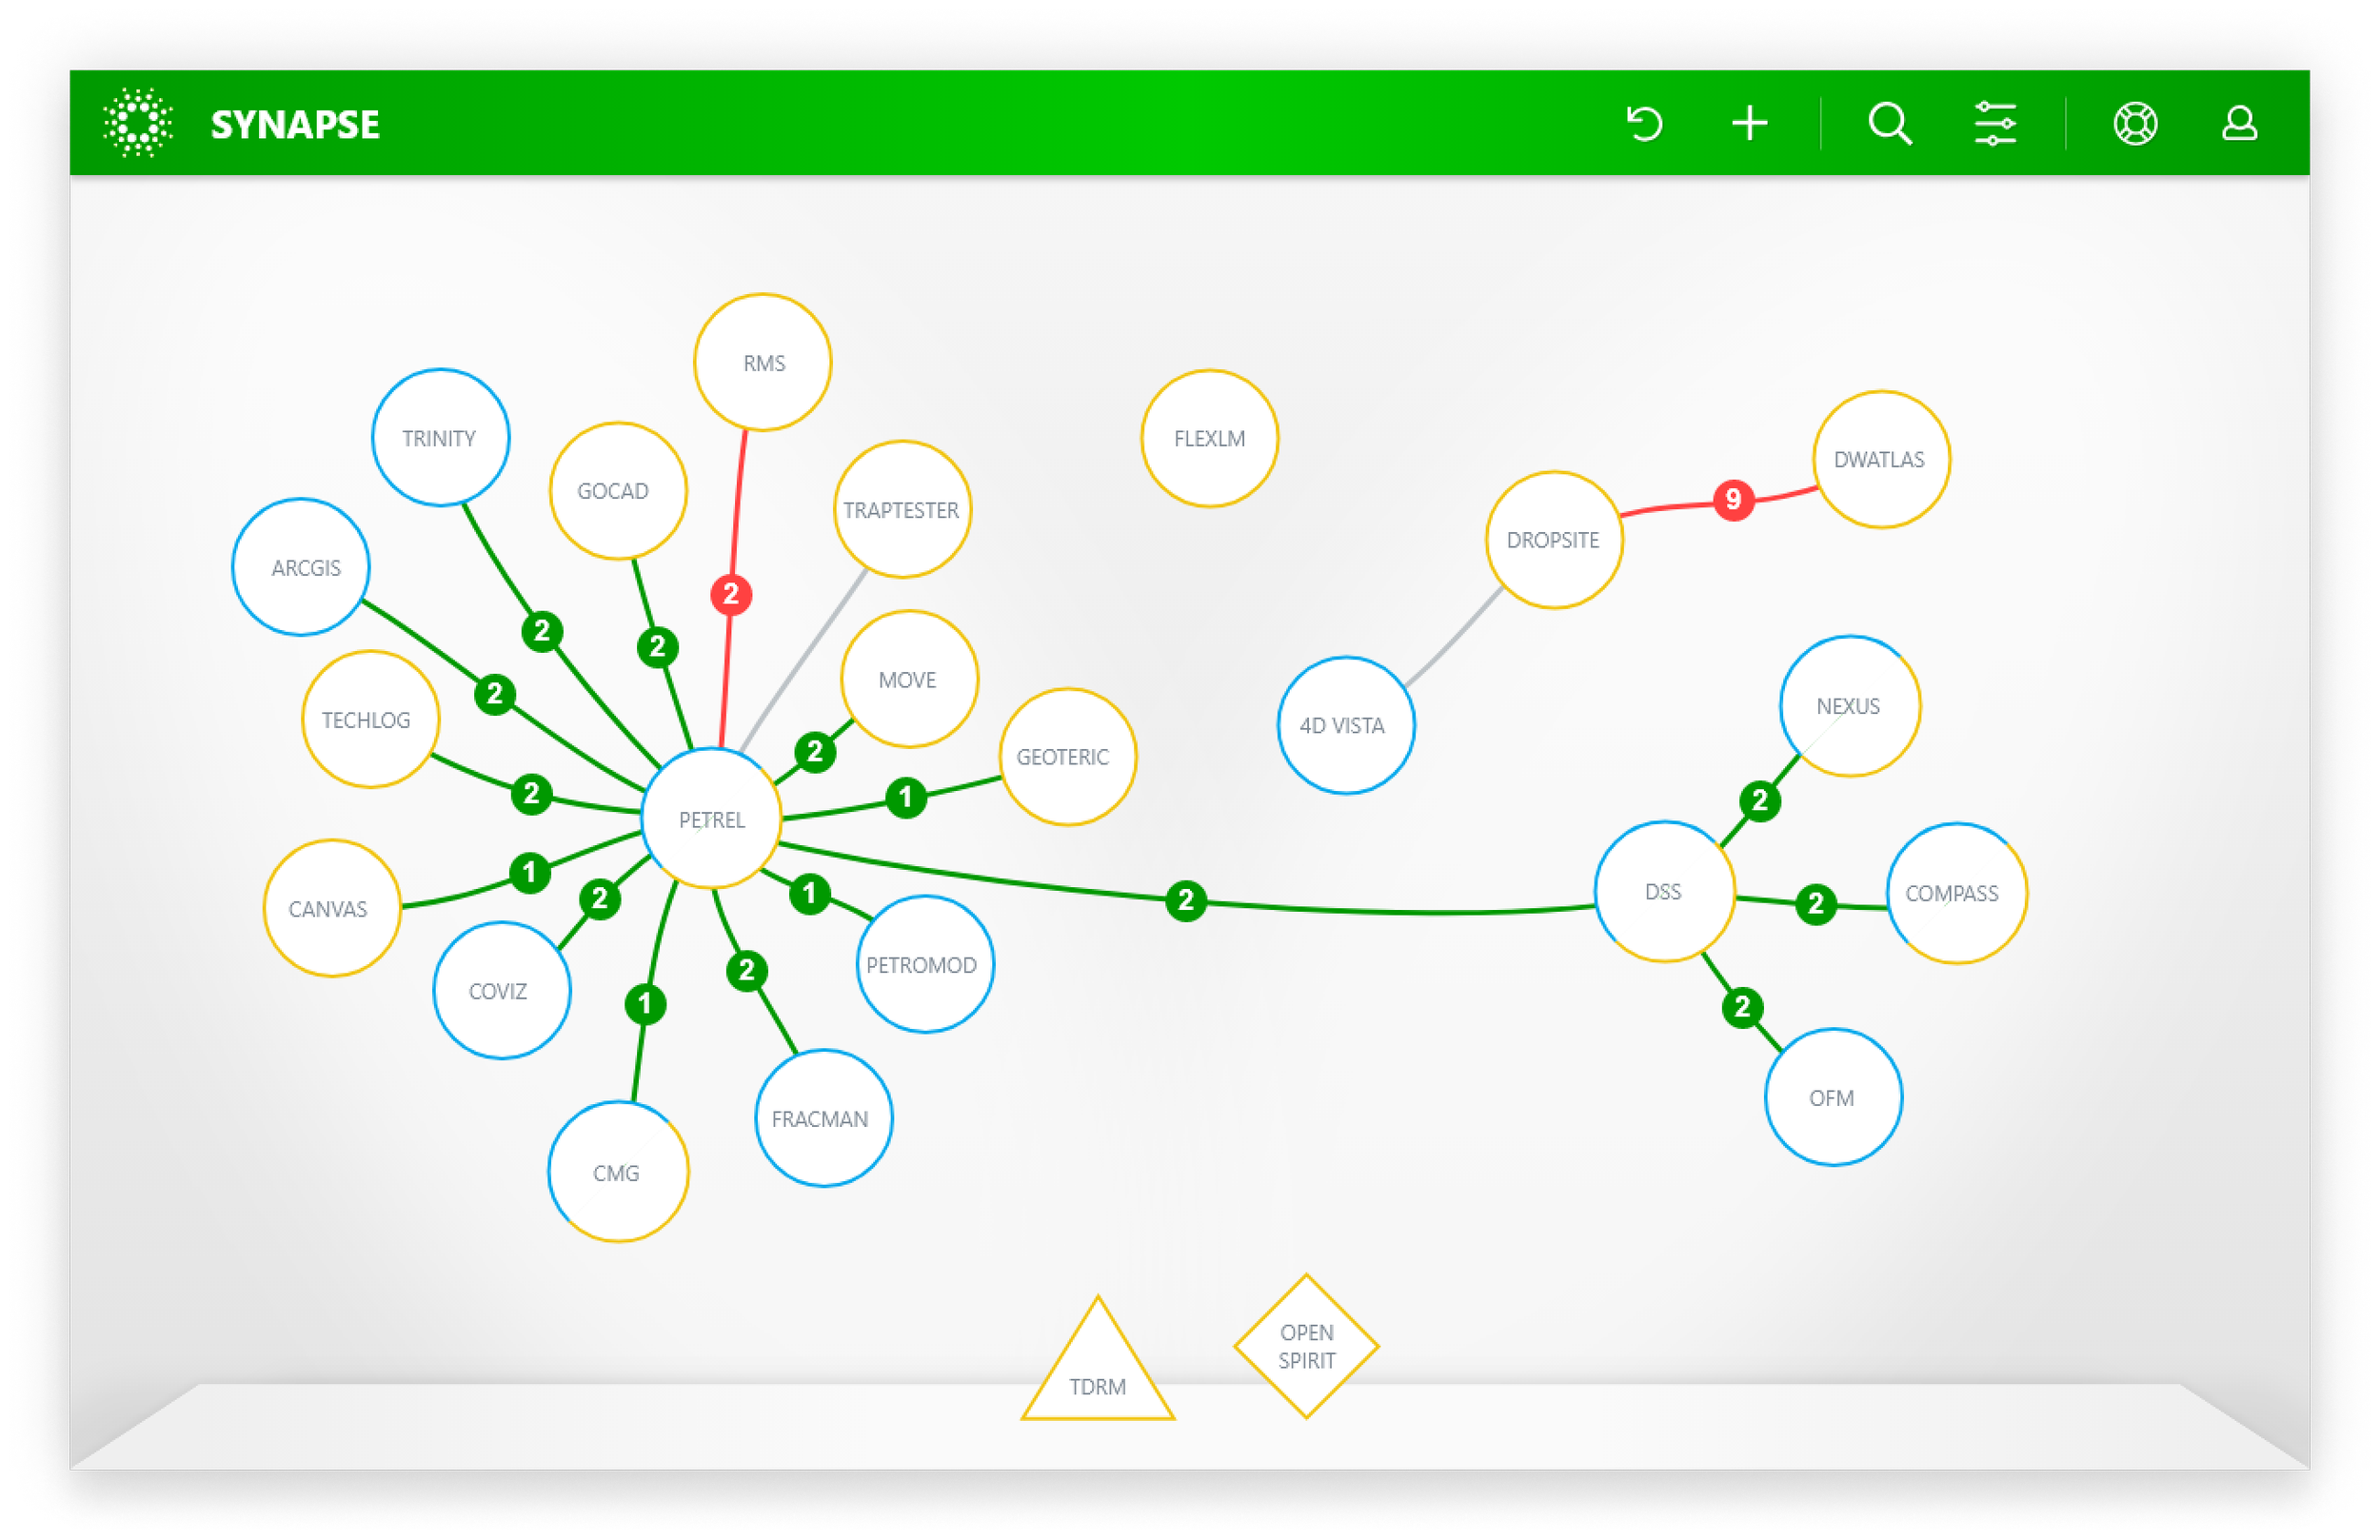
With this foundation established, the focus shifted to designing a dashboard that visualised the entire ecosystem. This enabled clear visibility of data flows and exposed the most efficient pathways for transforming datasets between applications, reducing duplication, improving consistency, and streamlining operational workflows.
SOLUTION
Following an extensive discovery phase, including interviews with both application creators and end users across the business, we developed a clear understanding of how the ecosystem operated in practice. This insight enabled us to define a solution that would simplify navigation, support knowledge sharing, and expose inefficiencies that were costing time and money at scale.
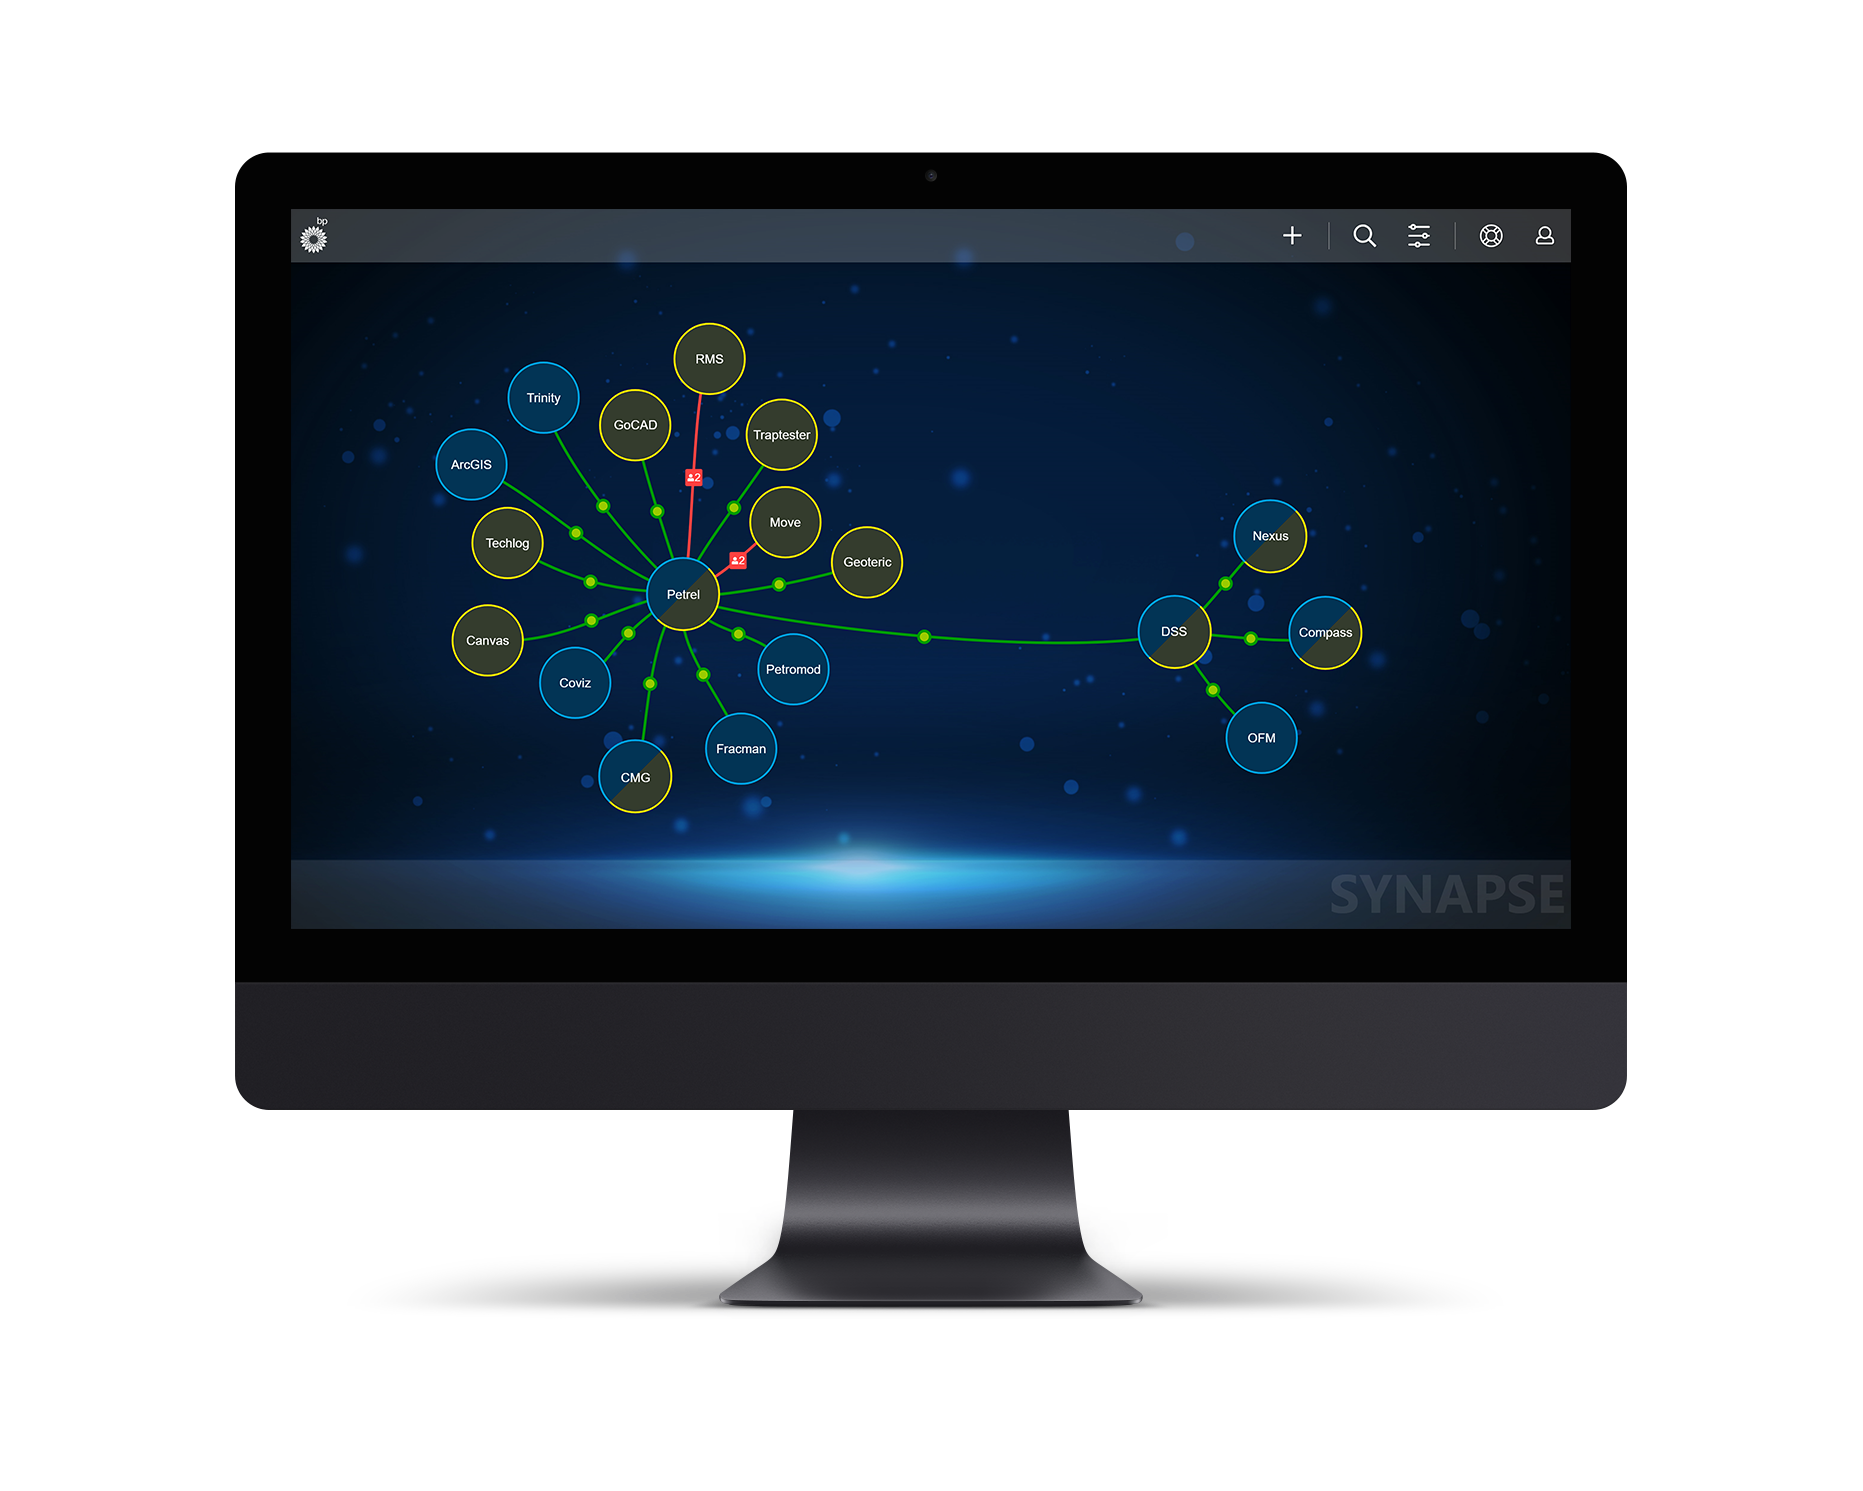
Early concepts explored 3D visualisation; however, these were set aside in favour of a more effective 2D interactive map built using web technologies, prioritising usability, performance, and accessibility.
I led the interface design and developed the front-end solution, creating an interactive environment where users could freely manipulate elements, explore application relationships, and trace data flows across the ecosystem. The result was a practical, user-driven tool that improved visibility, streamlined workflows, and supported more efficient decision-making.
OUTCOME
The delivery of an interactive ecosystem mapping tool transformed how application landscapes were understood and navigated across the business. By replacing fragmented, static documentation with a dynamic, user-driven interface, the solution made complex system relationships visible, actionable, and significantly easier to explore.
Crucially, the impact was felt at the individual user level. By enabling users to trace data flows and understand how applications interacted, the tool allowed them to identify and adopt more efficient ways of completing their tasks. These optimised workflows could also be shared across teams, compounding efficiency gains over time.
Measured impact included:
User-level time savings: Reduced time spent identifying optimal data pathways by 30–50%, with users saving several hours per week on tasks involving cross-system interactions
Workflow optimisation: Enabled discovery and sharing of more efficient processes, reducing reliance on trial-and-error and informal knowledge transfer
Operational visibility: Exposed inefficiencies and redundant steps within workflows, supporting continuous improvement and cost reduction initiatives
Adoption and usability: A performant 2D interface ensured accessibility and ease of use, driving adoption across both technical and non-technical users
From a delivery perspective, building the interface using web technologies ensured the tool remained lightweight, responsive, and scalable, while allowing users to freely manipulate and interrogate complex system relationships in real time.
Summary: A user-driven platform that improved individual productivity, unlocked more efficient ways of working, and enabled knowledge sharing at scale across BP’s application ecosystem.
UX CONSULTANT
Working in close collaboration with UX, we led interviews and workshops with users and stakeholders to define the product direction and align on core requirements.
Wireframes were used to establish structure and functionality, while mood boards set the visual direction. These outputs were synthesised into a clear foundation, enabling the project to move into delivery with shared understanding and design intent.
UI DESIGNER
For this project, I was given the freedom to move beyond established brand constraints and explore a more progressive visual direction. The goal was to create an experience that felt both intuitive and distinctly different from anything previously delivered within BP.
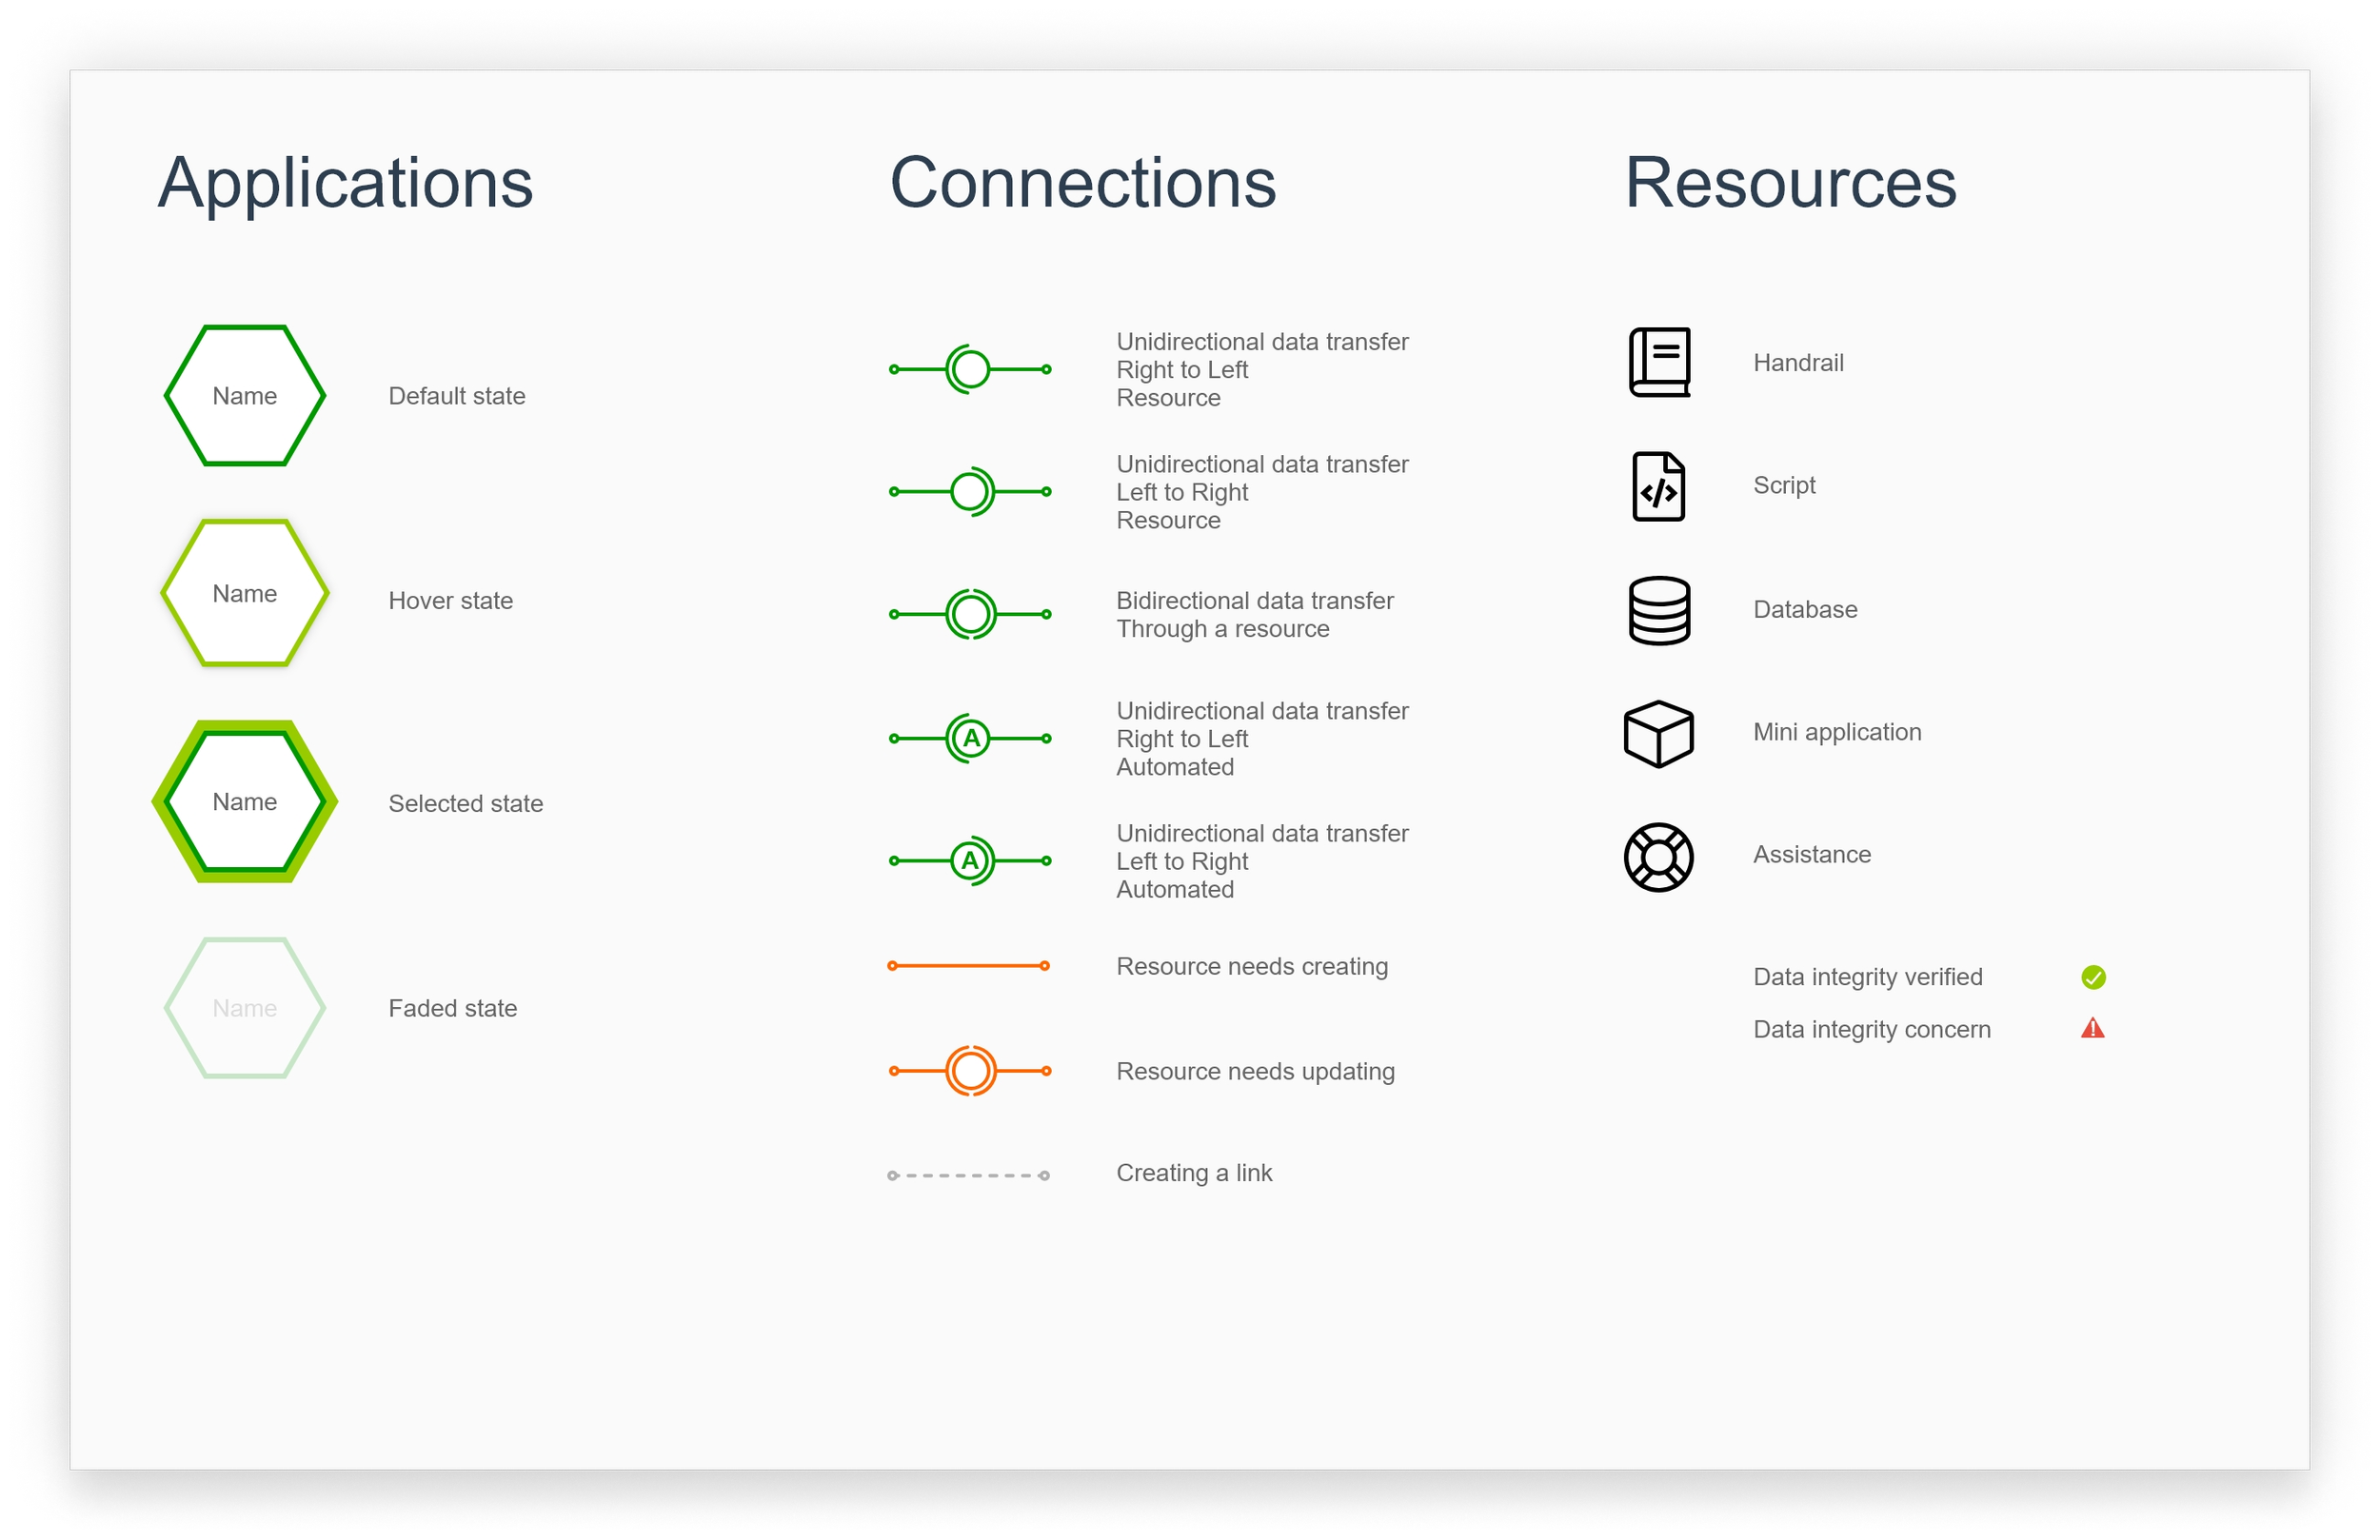
Through multiple iterations and concept explorations, I developed and presented several design directions to a panel of users and stakeholders. The chosen approach centred on an organic visual language - featuring fluid lines and soft, circular forms—designed to create a more engaging and approachable interface while maintaining clarity and usability.
BRAND SPECIALIST
Developed multiple logo concepts, each grounded in a distinct visual direction and strategic rationale aligned to the product. Presented a curated set of options to stakeholders, articulating the thinking behind each to support informed selection and final sign-off.
FRONT END DEVELOPER
Following UI sign-off, I defined the front-end architecture, evaluating multiple approaches before selecting a lightweight HTML, CSS, and JavaScript stack with jQuery for rapid prototyping, with a planned migration to Vue.js within a Node.js/Express application.
I translated the UX and UI into a cross-browser web application, wrapped in Node/Express to support scalability and integration. In parallel, I worked closely with backend developers, shaping API design, JSON structures, and endpoint definitions to ensure alignment with front-end requirements.
The application consumes data via AJAX, with both the front end and API deployed on Microsoft Azure, delivering a responsive and scalable solution.